Scanning an Artifact
Scanning is one of the primary functions of PolySwarm. When an Artifact is submitted, our network of engines will analyze that artifact for maliciousness and provide threat intelligence based on that analysis.
PolySwarm supports scanning of multiple types of Artifacts, currently including: Files, URLs, domains, and IP addresses.
Every scan produces a single Results page. That one page holds the engine verdicts, both sandbox detonations, the LLM report, static analysis tool output, and network intelligence for the Artifact. There is no separate page for sandbox results.
Where to Start
The Scan page at polyswarm.network/scan is where analysis starts. It is reached directly rather than from the top navigation.
The page has a search bar with three entry points below it.
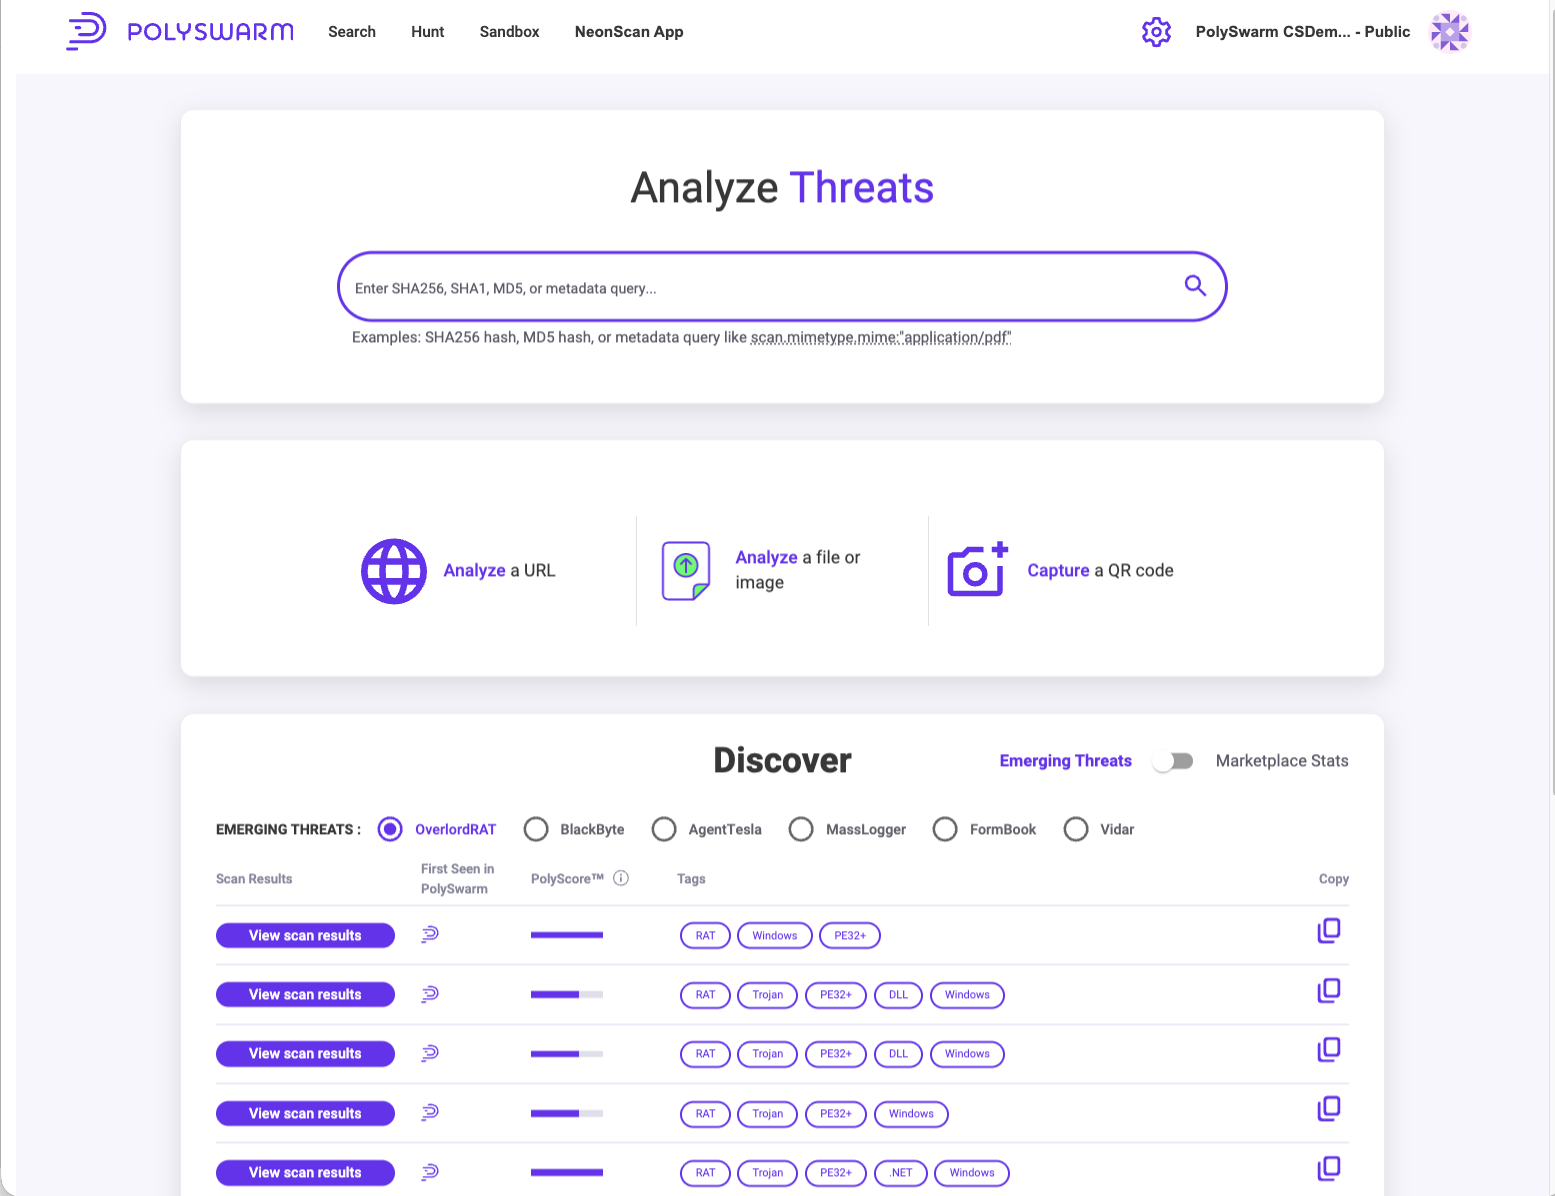
| Entry point | What is it for? |
|---|---|
| Search bar | Look up an Artifact PolySwarm has already seen, by SHA-256, SHA-1, or MD5 hash, or with a metadata query. |
| Analyze a URL | Submit a URL, domain, or IP address. See Analyze a URL, Domain, or IP Address. |
| Analyze a file or image | Submit a file from your local drive. See Analyze a File. |
| Capture a QR code | Submit an image of a QR code and have PolySwarm extract and analyze the URL in it. See Capture a QR Code. |
The search bar looks the Artifact up rather than submitting it. To analyze something new, use one of the three entry points. To re-run analysis on an Artifact you have looked up, use
Analyze Nowon its Results page.
For help building a metadata query, see the How-To Guide.
Analyze a File
Use Analyze a file or image to select a file from your local drive.
Once the file is submitted, the Results page will show the processing status, scan results, and metadata information.
Analyze a URL, Domain, or IP Address
Use Analyze a URL to submit a URL, domain, or IP address.
Once the Artifact is submitted, the Results page will show the processing status, scan results, and metadata information.
Capture a QR Code
Use Capture a QR code to submit an image of a QR code. PolySwarm extracts the URL from the image and analyzes that URL.
PolySwarm supports any bitmap image file type. Vector images such as SVG are not supported. The complete list is below.
-
Supported Bitmap Image File Types:
- JPEG / JPG (.jpeg, .jpg)
- PNG (.png)
- BMP (.bmp)
- GIF (.gif)
- TIFF (.tif, .tiff)
- WEBP (.webp)
- PPM / PGM / PBM / PNM (.ppm, .pgm, .pbm, .pnm) – Netpbm formats
- TGA (.tga) – Truevision TGA
- ICO (.ico) – Icon files
- PCX (.pcx)
- DDS (.dds) – DirectDraw Surface
- IM – Format used by PIL
- SGI (.sgi, .rgb) – Silicon Graphics
-
Not Supported (Vector or Non-Bitmap):
- SVG (.svg) – vector-based, not supported by Pillow
- PDF (unless converted to bitmap)
- EPS (requires Ghostscript and not always reliable)
Results Page
The Results page shows everything PolySwarm knows about an Artifact in one place.
You can reach it by:
- Submitting a file, URL, domain, or IP address for scanning.
- Searching for an Artifact, then using the Actions column in the Hash, Metadata, or Hunting results.
- Using the Actions button on the My Sandboxing, Team Sandboxing, or Sandbox History tables.
- Clicking an IOC or a dropped file on another Artifact's Results page, see Pivoting.
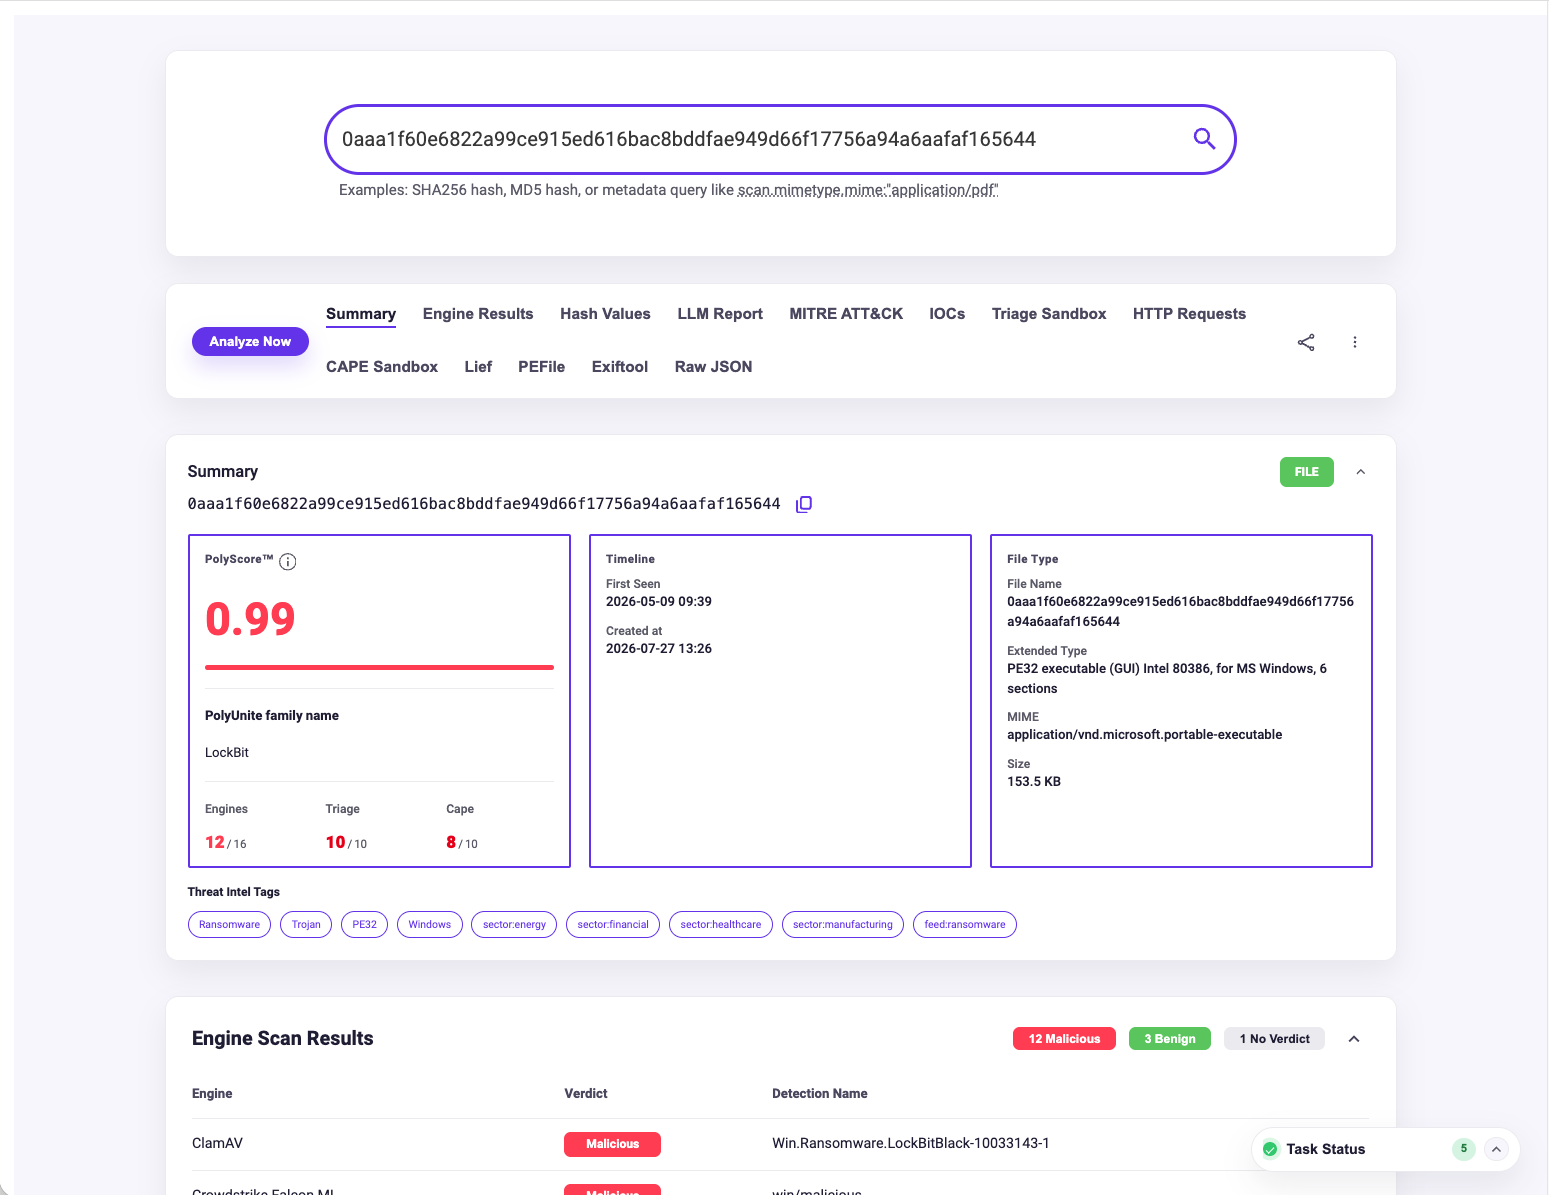
Search Bar
The search bar stays at the top of the Results page. You can enter a SHA-256 or MD5 hash, a URL, or a metadata query from here without leaving the page.
Tabs
Below the search bar is the tab strip. Clicking a tab jumps to that section of the page.
A tab is only shown when there is data behind it. Files and URLs therefore have different tabs, and two files can have different tabs depending on their file type.

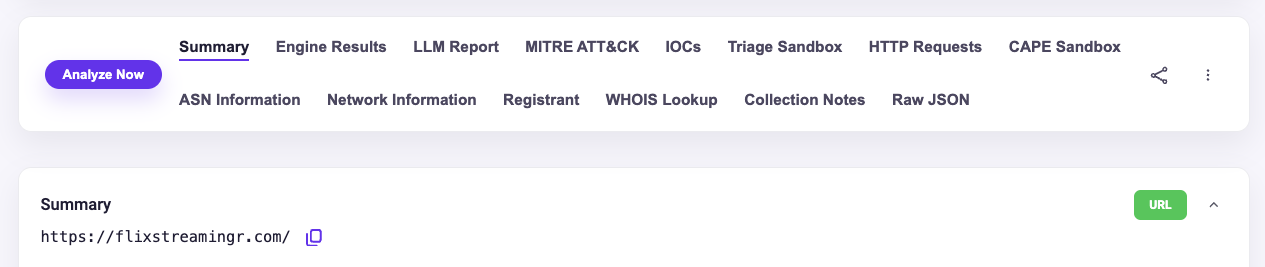
| Tab | Shown for | What it holds |
|---|---|---|
| Summary | All Artifacts | The overview of the Artifact and its scores. See Summary. |
| Known Good | Known good files | Which trusted catalog the file matched. See Known Good. |
| Engine Results | All Artifacts | Verdict and detection name from each engine. See Engine Results. |
| Hash Values | When available | Hashes and digests for the Artifact. See Hash Values. |
| LLM Report | All Artifacts | An AI-written summary of the analysis. See LLM Report. |
| MITRE ATT&CK | All Artifacts | Techniques seen during detonation. See MITRE ATT&CK. |
| IOCs | All Artifacts | IPs and URLs seen during detonation. See Indicators of Compromise. |
| Triage Sandbox | All Artifacts | The Triage detonation. See Triage Sandbox. |
| CAPE Sandbox | All Artifacts | The CAPE detonation. See CAPE Sandbox. |
| HTTP Requests | All Artifacts | HTTP traffic captured by Triage. See HTTP Requests. |
| Lief, PEFile, APKID, Exiftool | Files | Static analysis tool output. Only the tools that had something to report appear. See Static Analysis Tools. |
| ASN Information, Network Information, Registrant, TLS Certificate, WHOIS Lookup | URLs, domains, IPs | Infrastructure detail about the host. See Network Intelligence. |
| Raw JSON | All Artifacts | The full result as JSON. See Raw JSON. |
Summary
The Summary section at the top of the page gives you the verdict at a glance.
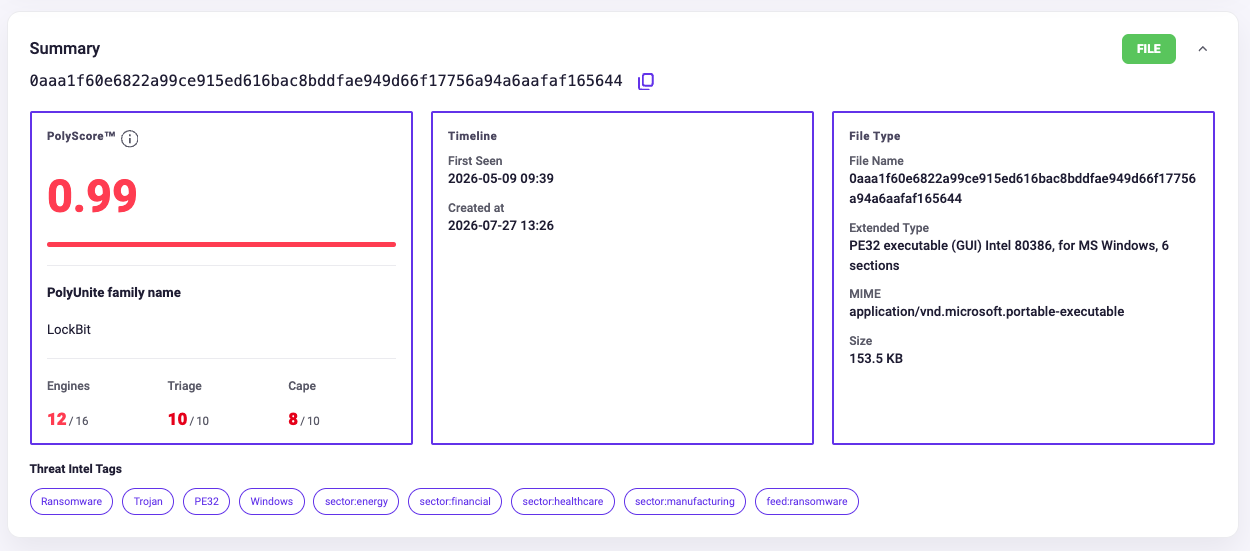
| Item | What is it for? |
|---|---|
| Artifact type badge | FILE or URL, so you can see what was analyzed. A known good file also carries a green Known Good badge. |
| SHA-256 | The SHA-256 hash of the Artifact, with a copy icon. For a URL, domain, or IP address this is the hash of the bytes of that string. |
| PolyScore | The probability that the Artifact is malicious. See Reading the Scores. |
| PolyUnite family name | A common malware family name drawn from all engines, the sandboxes, and analyst tags. Shows Unknown when no family has been identified. |
| Engines | How many engines returned a malicious verdict, out of the number that returned a verdict at all. |
| Triage and Cape | The malware score from each sandbox, out of 10. |
| Timeline | First Seen is when PolySwarm first saw the Artifact. Created at is when this result was produced. |
| File Type | File name, extended type, MIME type, and size. For a URL these fields are not populated. |
| Threat Intel Tags | Tags describing the Artifact, the sectors it has been seen targeting (sector:energy), and the feeds it appears in (feed:ransomware). |
Reading the Scores
The Summary shows several scores side by side. They are separate scales produced by different systems, so read each one on its own terms.
| Score | Scale | What it means |
|---|---|---|
| PolyScore | 0 to 1 | PolySwarm's own probability that the Artifact is malicious. Red is most likely malicious, amber is potentially malicious, green is likely not malicious. |
| Engines | Malicious/Total | 12/16 means 16 engines returned a verdict and 12 of them called the Artifact malicious. |
| Triage | 0 to 10 | Triage's own malware score, with its own verdict label such as Known bad. |
| Cape | 0 to 10 | CAPE's own malware score, with its own verdict label such as Malicious. |
The two sandboxes score independently and can disagree about the same file. A LockBit sample can score
10andKnown badon Triage while scoring8andMaliciouson CAPE. A low score from one sandbox is not a clean bill of health, so read both alongside the engine verdicts and the PolyScore.
Analysis Status Panel
Analysis tasks finish at different times, so the page fills in as results arrive. The panel in the lower right of the page lists each task with its ID and current status.
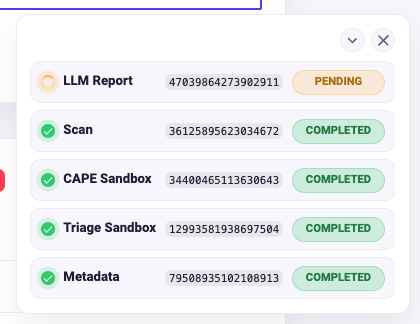
The tasks listed are Scan, Metadata, CAPE Sandbox, Triage Sandbox, LLM Report, and, for URLs and IP addresses, IP/URL Analysis.
| Status | What is it for? |
|---|---|
PENDING |
The task is queued or still running. Its section will populate when it completes. |
COMPLETED |
The task has finished and its results are on the page. |
KNOWN GOOD |
The task was skipped because the file is a known good binary. See Known Good. |
Use the chevron to collapse the panel down to a Task Status pill showing how many tasks there are, and the cross to close it. To bring it back, use View Task Progress in the Actions menu.
Quote the task ID shown here if you need to raise a question with us about a specific analysis.
Analyze Now and the Actions Menu
To the left of the tab strip is the Analyze Now button, which submits the Artifact for fresh analysis. Use it when the last result is old, or when you want an Artifact that has only been scanned to also be detonated in the sandboxes.
Beside the tab strip are the Share icon, which copies a link to the Results page, and the ⋮ icon, which opens the Actions menu.
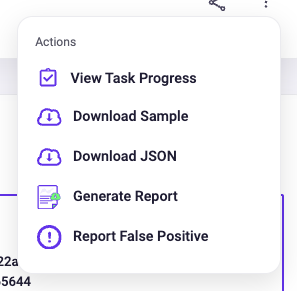
| Action | What is it for? |
|---|---|
| View Task Progress | Reopen the Analysis Status Panel. |
| Download Sample | Download the Artifact as an encrypted .zip file. For a URL, domain, or IP address this is a text file containing that string. |
| Download JSON | Download the full result as a JSON file. |
| Generate Report | Generate a PDF or HTML report, choosing which sections to include. Set your report branding in Settings. |
| Report False Positive | Tell us that you believe a verdict on this Artifact is wrong. |
The default password on downloaded Artifacts is
infected. A Team Owner or Team Admin can change it in Settings.
Engine Results
The Engine Results tab shows the Engine Scan Results section, which lists every engine that returned a verdict on the Artifact and what it called it.
The heading carries a count of each verdict, for example 12 Malicious, 3 Benign, and 1 No Verdict.
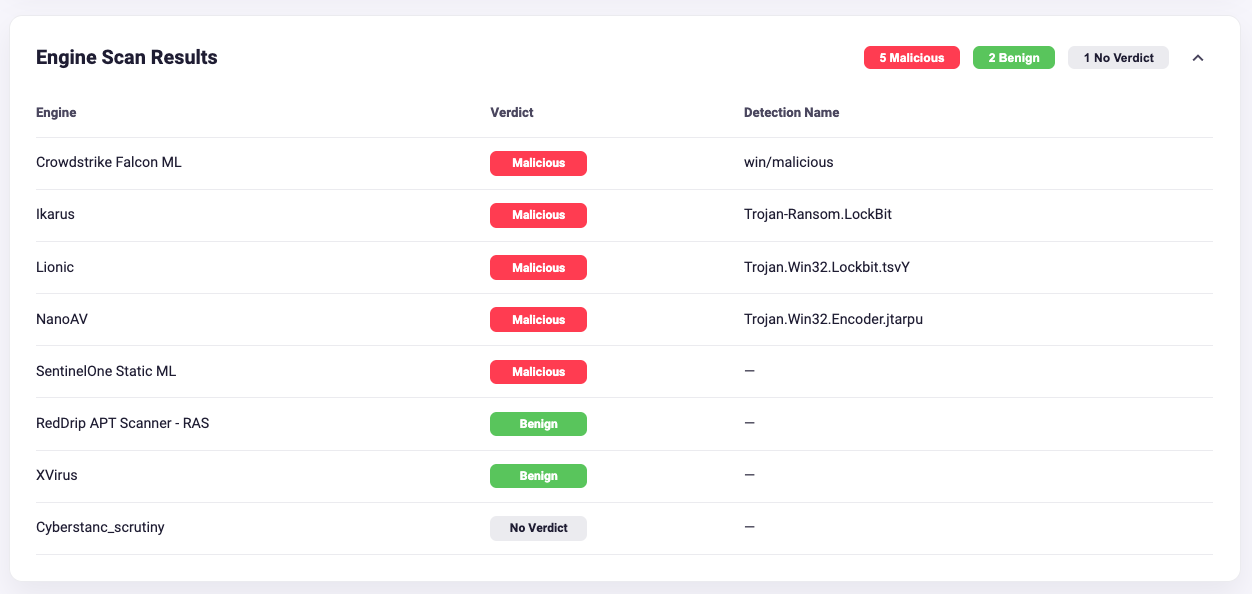
| Column | What is it for? |
|---|---|
| Engine | The name of the engine. |
| Verdict | Malicious, Benign, or No Verdict. No Verdict means the engine chose not to analyze the Artifact, so it tells you nothing about it. |
| Detection Name | The engine's own name for what it found, for example Win.Ransomware.LockBitBlack-10033143-1. Shown as — when the engine did not supply one. |
Engines that return
No Verdictare not counted in the Engines score in the Summary.
Known Good
Some files are already known to be safe. When a file's SHA-256 exactly matches a trusted catalog of legitimate software, PolySwarm marks it Known Good and does not scan, sandbox, or store it. No scan or API quota is spent on a file that needs no analysis.
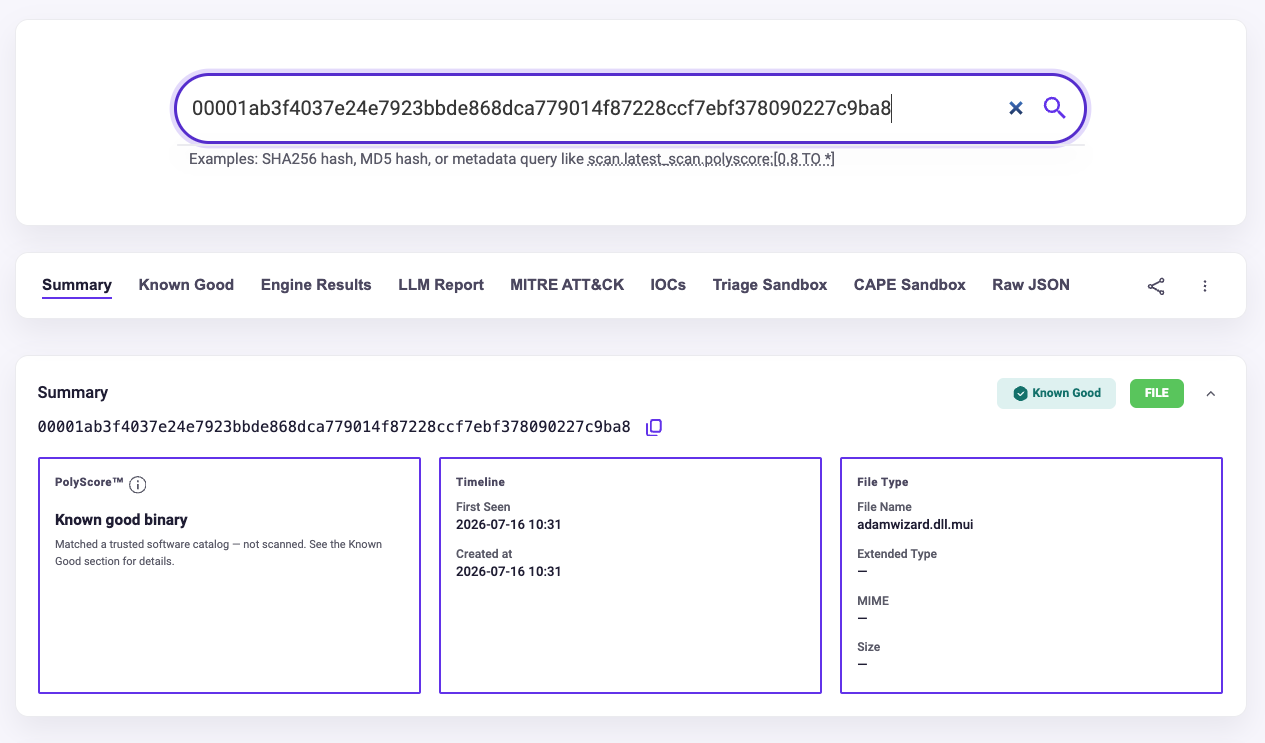
On the Results page for a known good file:
- The Summary carries a green Known Good badge, and in place of a PolyScore it reads "Known good binary".
- The Analysis Status Panel shows
KNOWN GOODfor Scan, CAPE Sandbox, and Triage Sandbox. - A Known Good section shows how many trusted catalogs vouch for the file and what each one records about it.
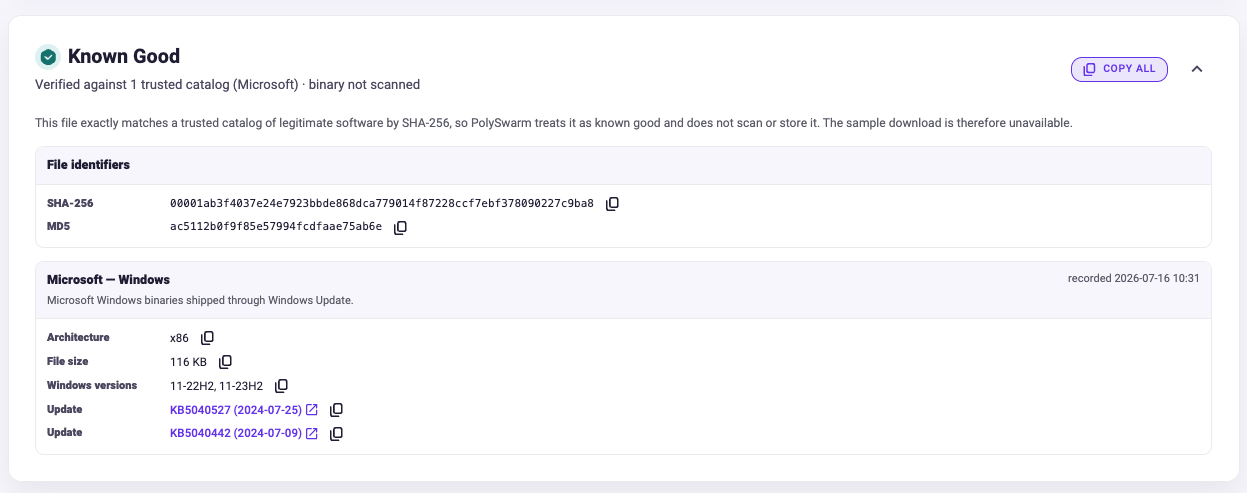
The Known Good section contains:
| Item | What is it for? |
|---|---|
| File identifiers | The SHA-256 and MD5 of the file. |
| Catalog card | One card per catalog that matched, naming the vendor and product, what the catalog covers, and when the match was recorded. |
| Catalog detail | What that catalog knows about the file. For Microsoft Windows this includes the architecture, file size, the Windows versions it appears in, and the KB updates it shipped in, each linking to the Microsoft advisory. |
| Copy All | Copy the whole section to your clipboard. |
Known good binaries cannot be downloaded. The file was verified by its hash and never stored, so
Download Sampleis unavailable.Known good binaries are also the only Artifacts with a true PolyScore of
0.0.Coverage is currently for Windows binaries, with additional platforms planned. Catalogs currently include Microsoft Windows, top commercial software, and golden OS images from the National Software Reference Library (NSRL).
This is a different feature from known good domain and IP checking, which is available through the CLI and the API. Known Good Binaries applies to files.
LLM Report
An LLM Report is generated with every scan. It reads the engine verdicts, both sandbox detonations, and the static analysis output, then writes up what they add up to.
The report is generated after the rest of the analysis, so it shows as PENDING in the Analysis Status Panel while the rest of the page is already populated.
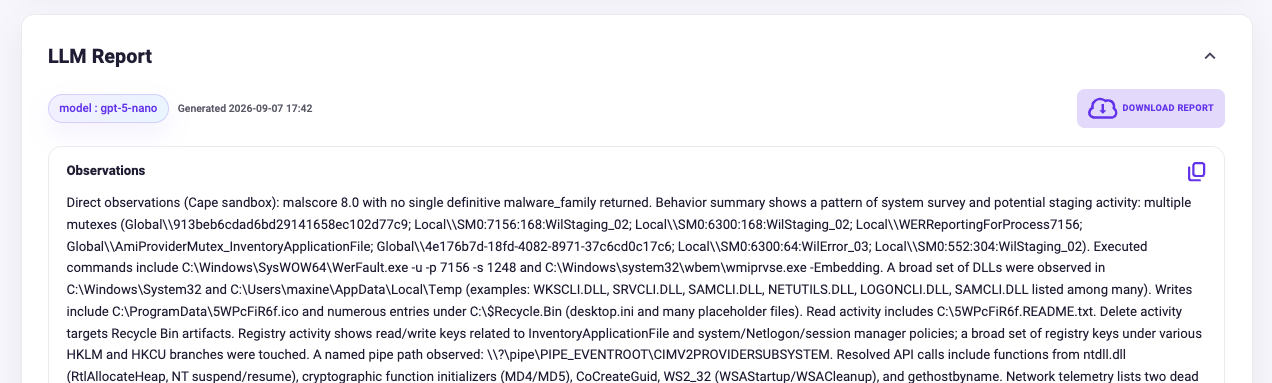
| Section | What is it for? |
|---|---|
| Observations | What was actually seen during analysis, attributed to the source it came from. |
| Recommended Actions | What to do about the Artifact. |
| Bottom Line | The short answer, for when you need one line rather than the detail. |
The section heading shows which model wrote the report and when it was generated. Each part of the report can be copied, and Download Report saves the whole report locally.
Sandbox Results
PolySwarm detonates Artifacts in two sandboxes, Triage and CAPE, and both sets of results appear on the Results page in their own sections.
Submitting an Artifact for detonation, and tracking submissions you have already made, is covered on the Sandbox page.
To use Sandboxing functionality, you must have this paid feature enabled on your Plan. You can check your Usage page to see if you have it.
Triage Sandbox
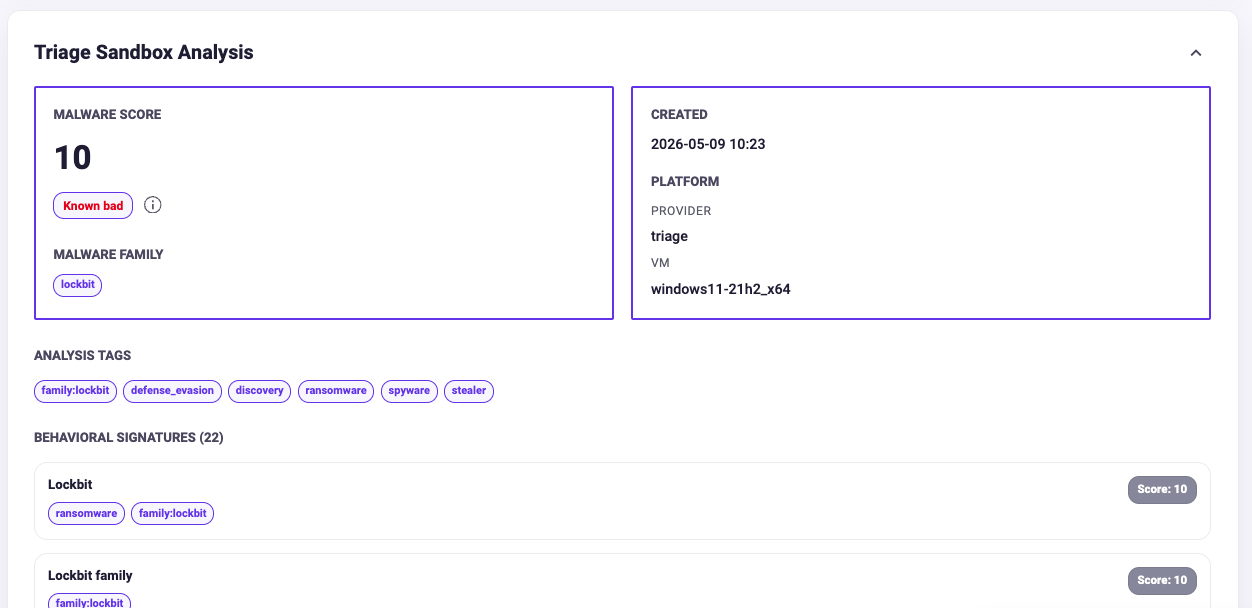
| Item | What is it for? |
|---|---|
| Malware Score | Triage's own score out of 10, with its verdict label, for example Known bad. |
| Malware Family | The family Triage identified, for example lockbit. Shows N/A when no family was identified. |
| Created | When the detonation ran. |
| Platform | The provider and the VM image the Artifact was detonated on, for example triage and windows11-21h2_x64. |
| Analysis Tags | Tags summarising the detonation, such as family:lockbit, ransomware, stealer, and defense_evasion. |
| Behavioral Signatures | The behaviours Triage matched, each with its own score and tags. Tags include MITRE technique IDs such as T1552.001. |
| Processes | The processes that ran during detonation, with their PID, parent PID, and full command line. Long command lines have a View full link. |
| Files Written | Files written during detonation, with their path and SHA-256. |
| Video Playback | A recording of the detonation. |
Long lists are shortened, so use Show more to see the rest.
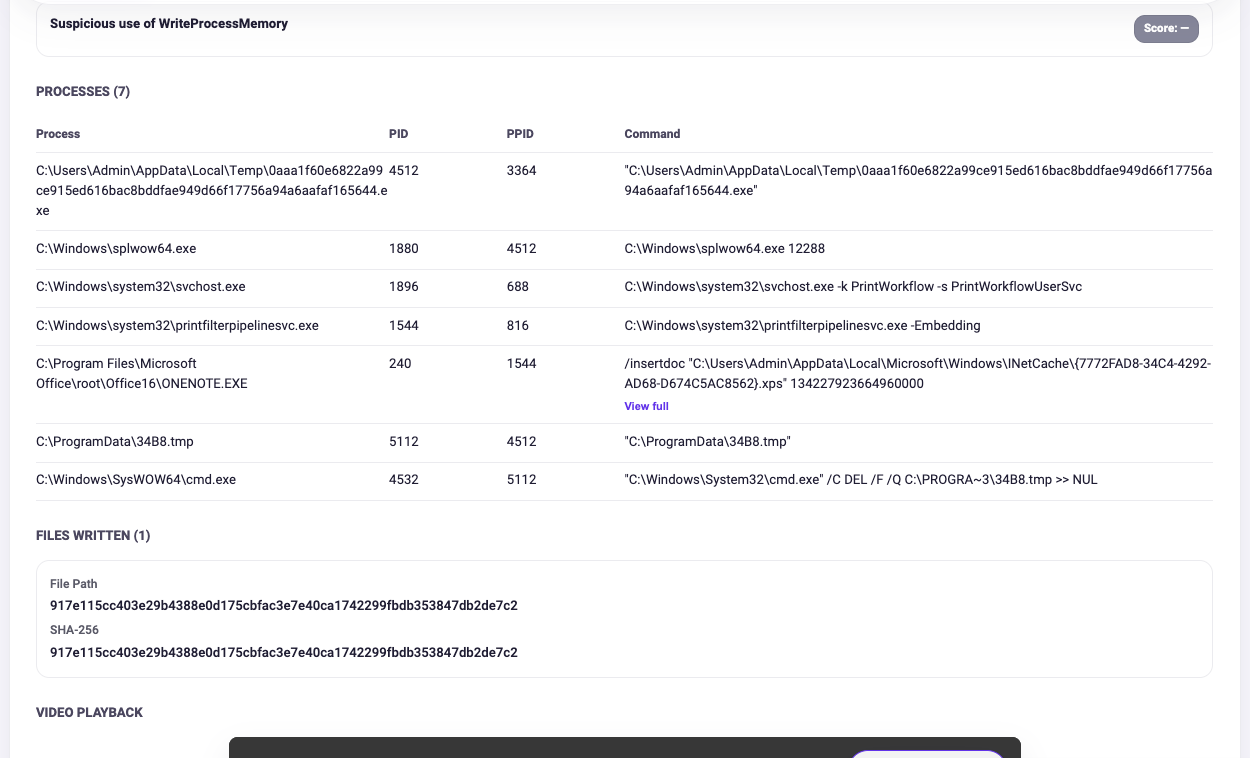
Where the detonation produced them, further blocks appear in this section for the recovered malware configuration and for the downloadable detonation artifacts, such as the packet capture and memory dumps.
Files written during detonation are always downloaded inside an encrypted
.zipfile, to stop them triggering the AV on your own machine.To analyze a file written during detonation in its own right, click it. See Pivoting.
CAPE Sandbox
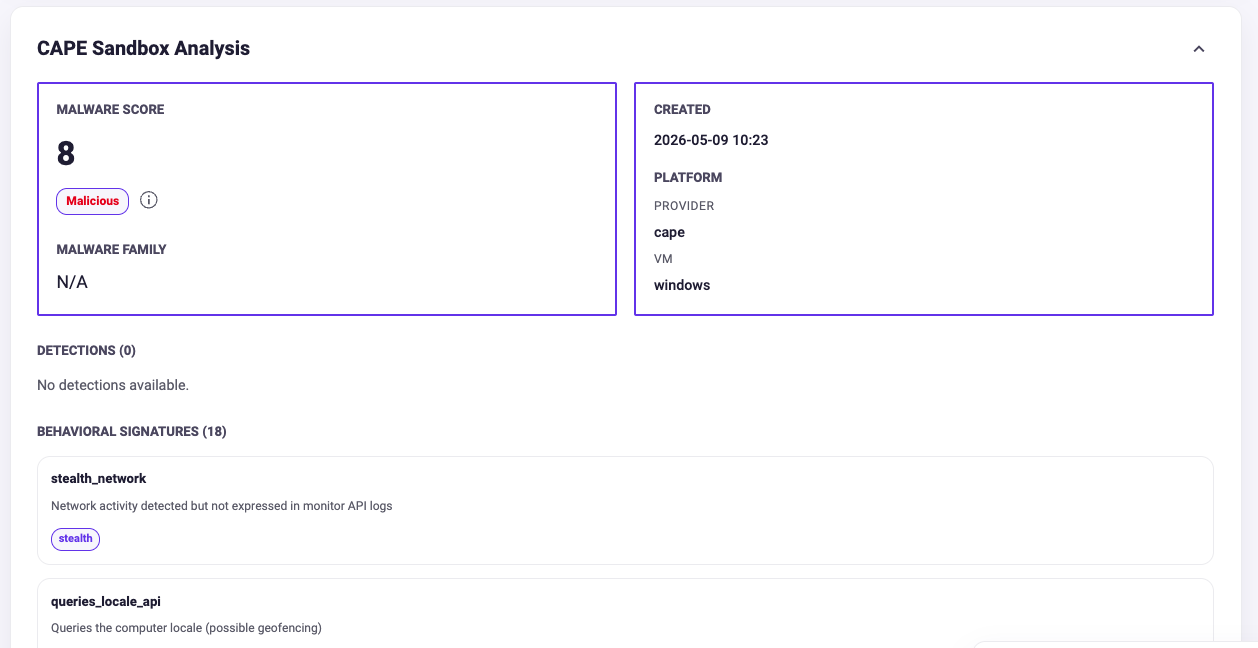
| Item | What is it for? |
|---|---|
| Malware Score | CAPE's own score out of 10, with its verdict label, for example Malicious. |
| Malware Family | The family CAPE identified. Shows N/A when no family was identified. |
| Created | When the detonation ran. |
| Platform | The provider and the VM the Artifact was detonated on, for example cape and windows. |
| Detections | Signature detections CAPE returned at runtime. This can be 0 even on a file CAPE scores as malicious. |
| Behavioral Signatures | The behaviours CAPE matched, each with a description and tags such as stealth, anti-debug, and geofence. |
| Network Activity | Connected hosts and TCP connections seen during detonation, each with a copy icon and a Copy All for the whole list. |
| Screenshots | Screen captures taken during detonation, browsable one at a time and downloadable. |
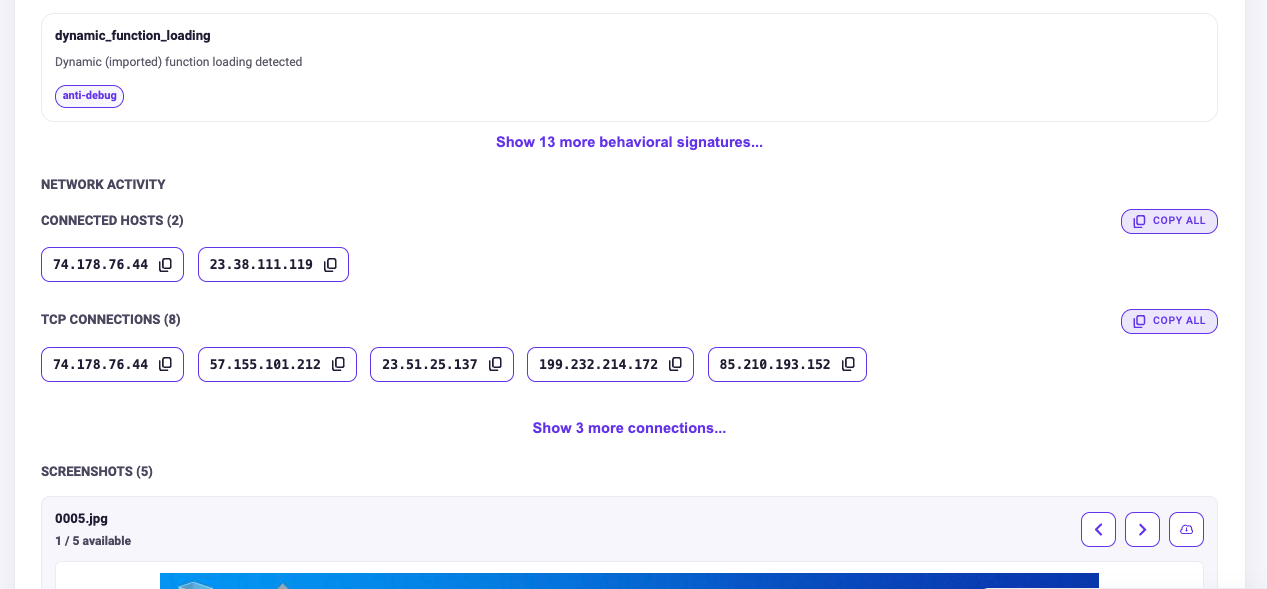
As with Triage, further blocks appear where the detonation produced them, for the files written during detonation, the recovered malware configuration including output from parsers such as the CobaltStrike parser, and the downloadable detonation artifacts.
HTTP Requests
The HTTP Requests section shows the HTTP traffic captured during detonation.
This section is only available for Triage detonations.
MITRE ATT&CK
The MITRE ATT&CK Matrix shows the techniques triggered across both sandbox detonations, grouped by tactic.
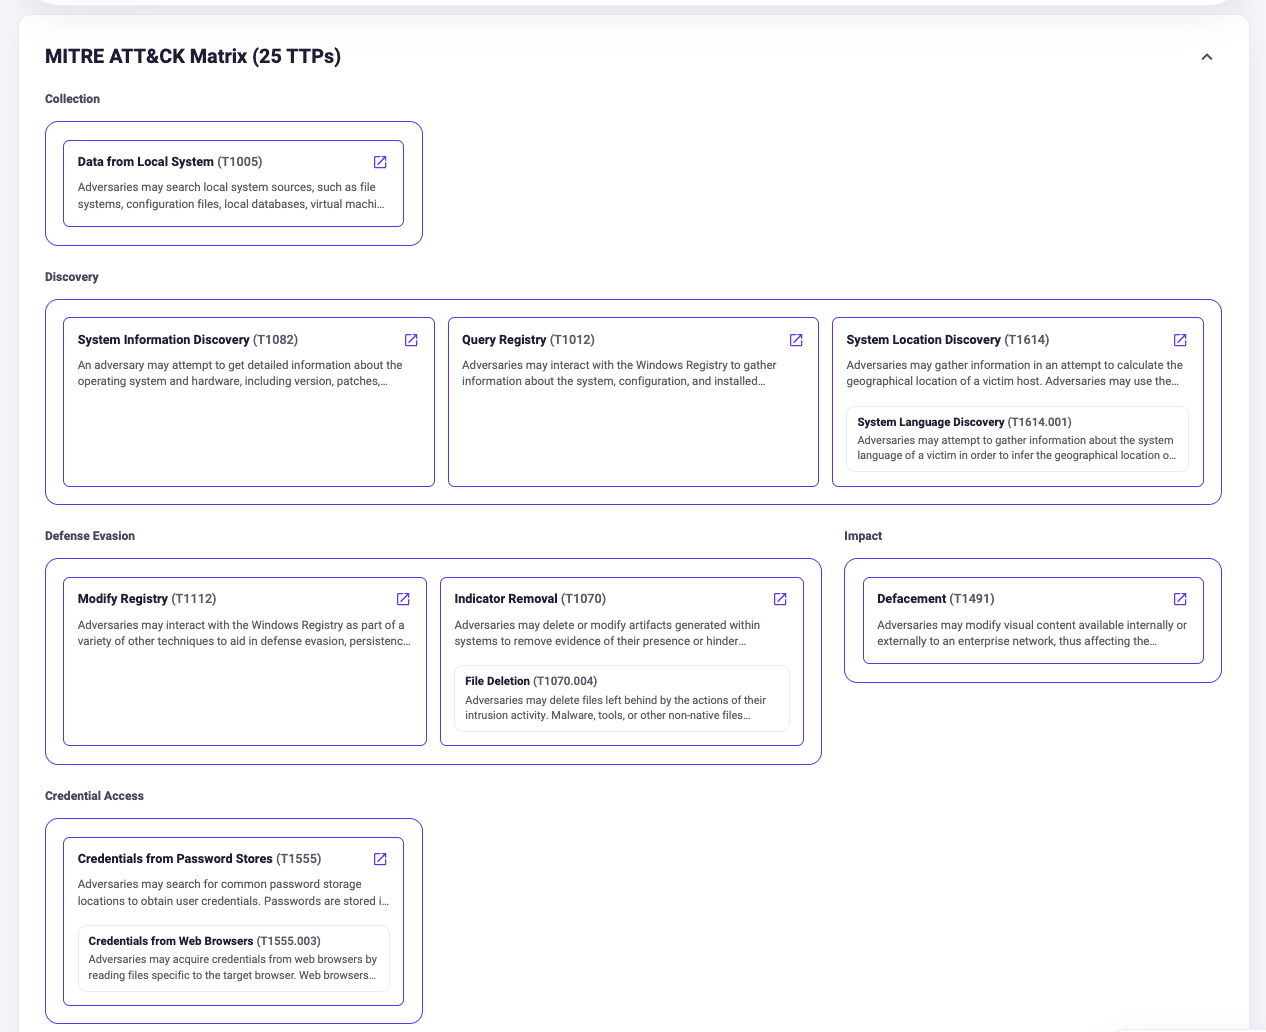
Each technique is shown as a card with its name, its MITRE technique ID, a short description, and a link out to the technique on the MITRE ATT&CK website. Where a sub-technique was seen, it is nested inside its parent technique's card, so System Language Discovery (T1614.001) sits inside System Location Discovery (T1614).
Techniques are drawn from the sandbox metadata that is available, so they can change as new behaviour is observed.
You can also search PolySwarm for other Artifacts that triggered a given technique, see IOC Searching.
Indicators of Compromise
The Indicators of Compromise section lists the IP addresses and URLs observed during detonation, taken from both the Triage and CAPE results.
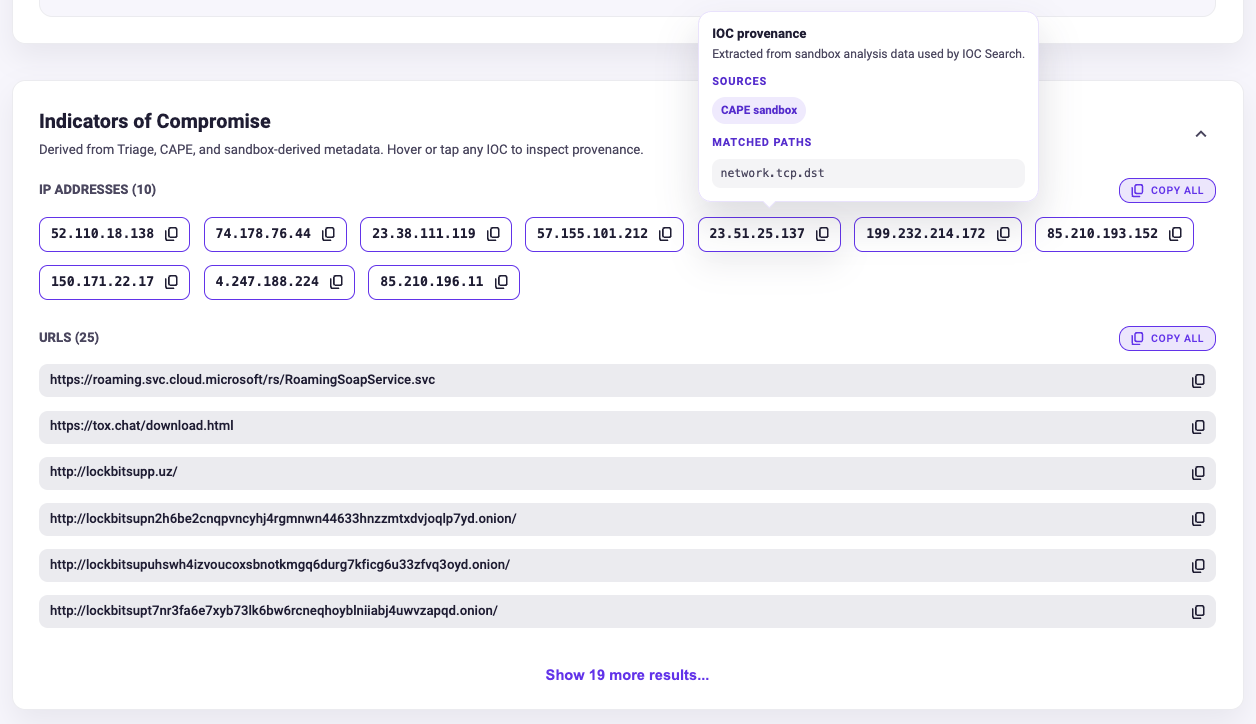
Each group carries a count, and each IOC has a copy icon. Copy All copies the whole group. IP addresses are shown as chips and URLs as full-width rows. Long lists are shortened, so use Show more results to see the rest.
Hovering over an IOC shows its provenance: the sandbox it came from under Sources, and the field in that sandbox's data it was taken from under Matched Paths, for example network.tcp.dst.
Clicking an IOC analyzes it in its own right, see Pivoting.
These are the same IOCs returned by IOC Searching.
Network Intelligence
For a URL, domain, or IP address, PolySwarm collects the surrounding infrastructure detail as well as the verdict. This runs as part of scanning, and the results are split across several sections, each with its own tab.
Only the sections that have data are shown, so a given Artifact may not have all of them.
| Section | What is it for? |
|---|---|
| ASN Information | Who owns the address space and roughly where it is: ASN number and name, country, time zone, coordinates, and the accuracy radius of that location. |
| Network Information | How the target resolves: the target itself, its IP address and IP version, the network block, address range, parent networks and CIDRs, the network name, the allocation type, and its status. |
| Registrant | The registrant details recorded for the domain. |
| TLS Certificate | The certificate presented by the host: version, serial number, signature algorithm, and SHA-1 and SHA-256 thumbprints, plus the issuer's common name and organization. |
| WHOIS Lookup | The WHOIS server queried and its full raw response, which you can scroll and copy. |
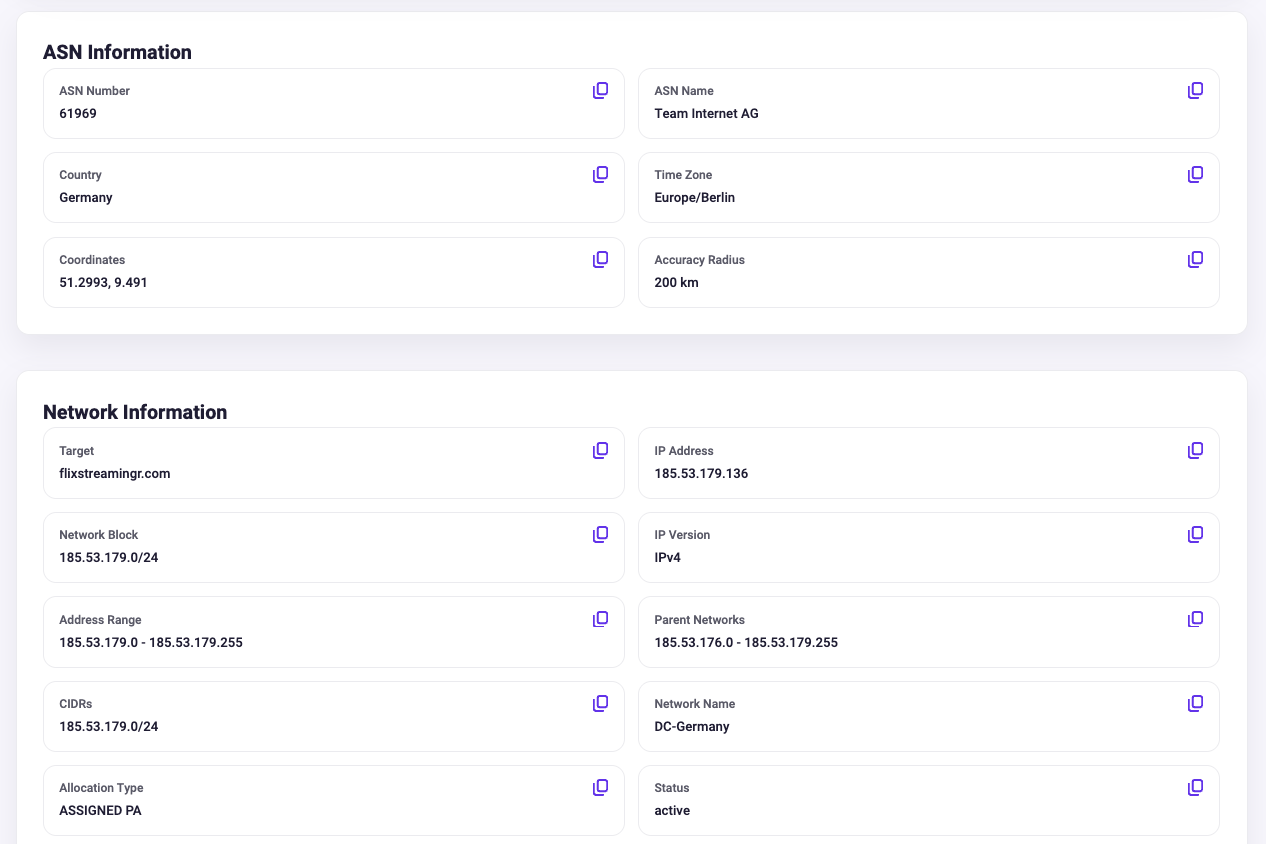
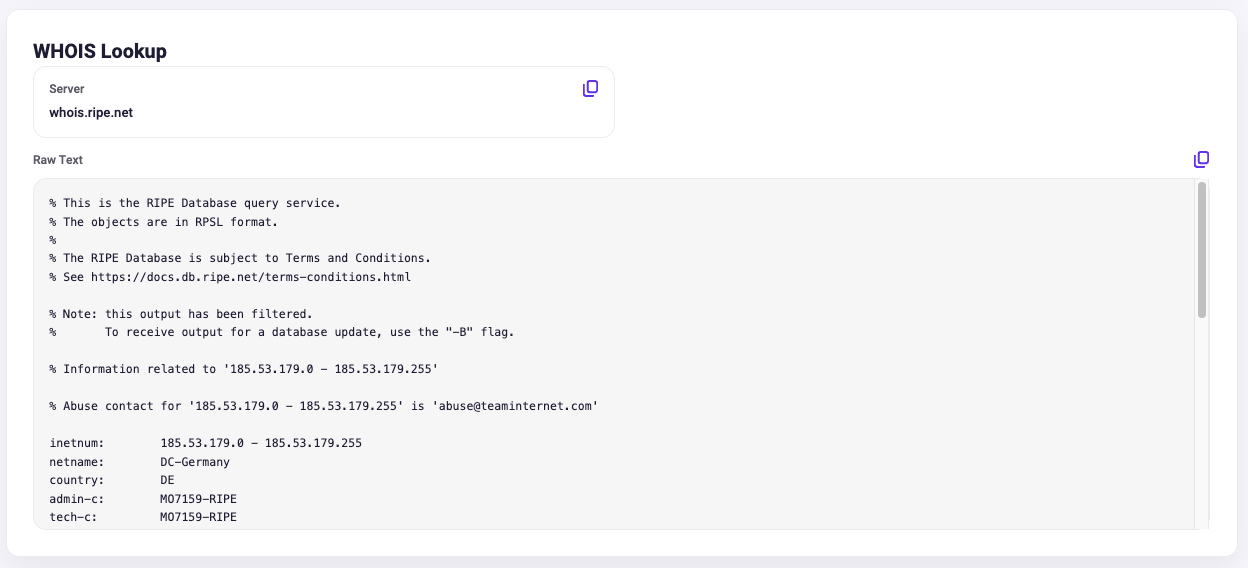
The certificate issuer and the ASN are often what ties a lookalike domain to the rest of a campaign, so they are worth checking even when the verdict is inconclusive.
Hash Values
The Hash Values section lists the hashes and digests PolySwarm holds for the Artifact, including Authentihash, MD5, SHA-1, SHA-256, SHA3-256, and SHA3-512.
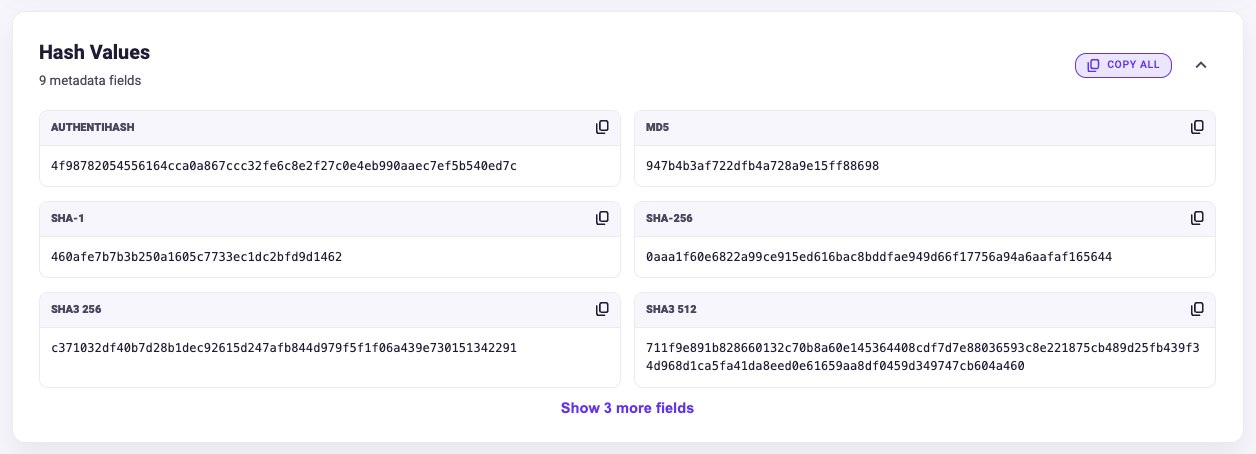
The heading shows how many metadata fields are available. Use Show more fields to see the rest, and Copy All to copy the whole section.
Static Analysis Tools
PolySwarm runs a collection of static analysis tools over every file it scans. Each tool has its own section, holding the metadata that tool extracted.
| Tool | What it covers |
|---|---|
| PEFile | Windows Portable Executable structure. |
| LIEF | Executable formats, including their sections, imports, and signatures. |
| APKID | Android packers, obfuscators, and compilers. |
| Exiftool | Embedded file metadata, such as timestamps and authoring information. |
Some tools only produce results for specific file types, so a file will only have sections for the tools that had something to report on it. Sections with many fields are shortened, so use Show more fields to see the rest.
These sections are only shown for files. For URLs, domains, and IP addresses, see Network Information.
Raw JSON
The Raw JSON section gives you the whole result as a browsable JSON object, with artifact_instance, llm_report_task, metadata, sandbox, and tasks at the top level.
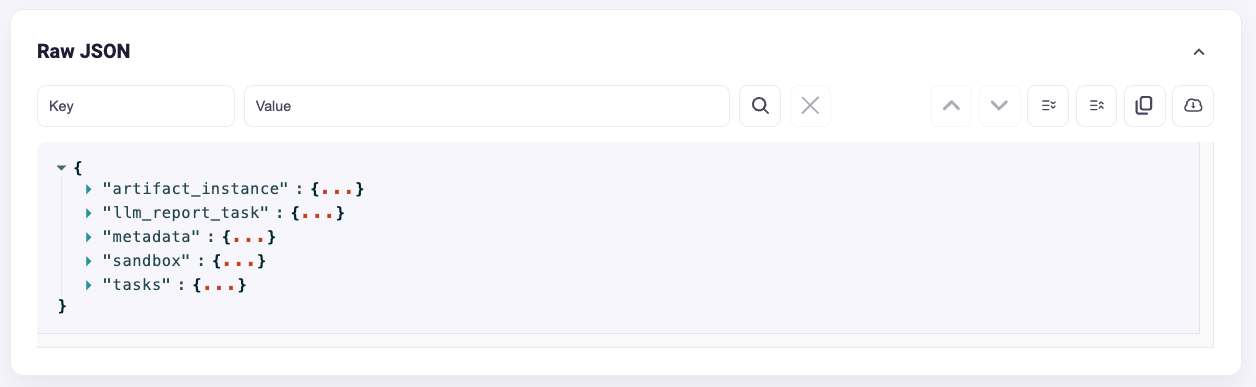
- Search by Key, by Value, or both, then step through the matches.
- Expand and collapse the whole object, or expand parts of it to browse manually.
- Copy the object to your clipboard, or download it as a file.
Each sandbox also produces its own full report, which is available under Downloads in the Triage and CAPE sections.
Pivoting
Pivoting lets you move from one Artifact to the next without leaving the Results page.
Anything PolySwarm can analyze in its own right is clickable:
- IOCs. Click any IP address or URL in the Indicators of Compromise section to scan or sandbox it. You land on the Results page for that IOC.
- Dropped files. Click any dropped file in the Triage or CAPE sections to scan or sandbox it. You land on the Results page for that file.
From there you can pivot again, following a campaign from the file you started with out to its infrastructure and back to the files that infrastructure serves.
To find every Artifact that shares an attribute rather than following one at a time, use Metadata Searching or IOC Searching.